#30daymapchallange Day 1 Points
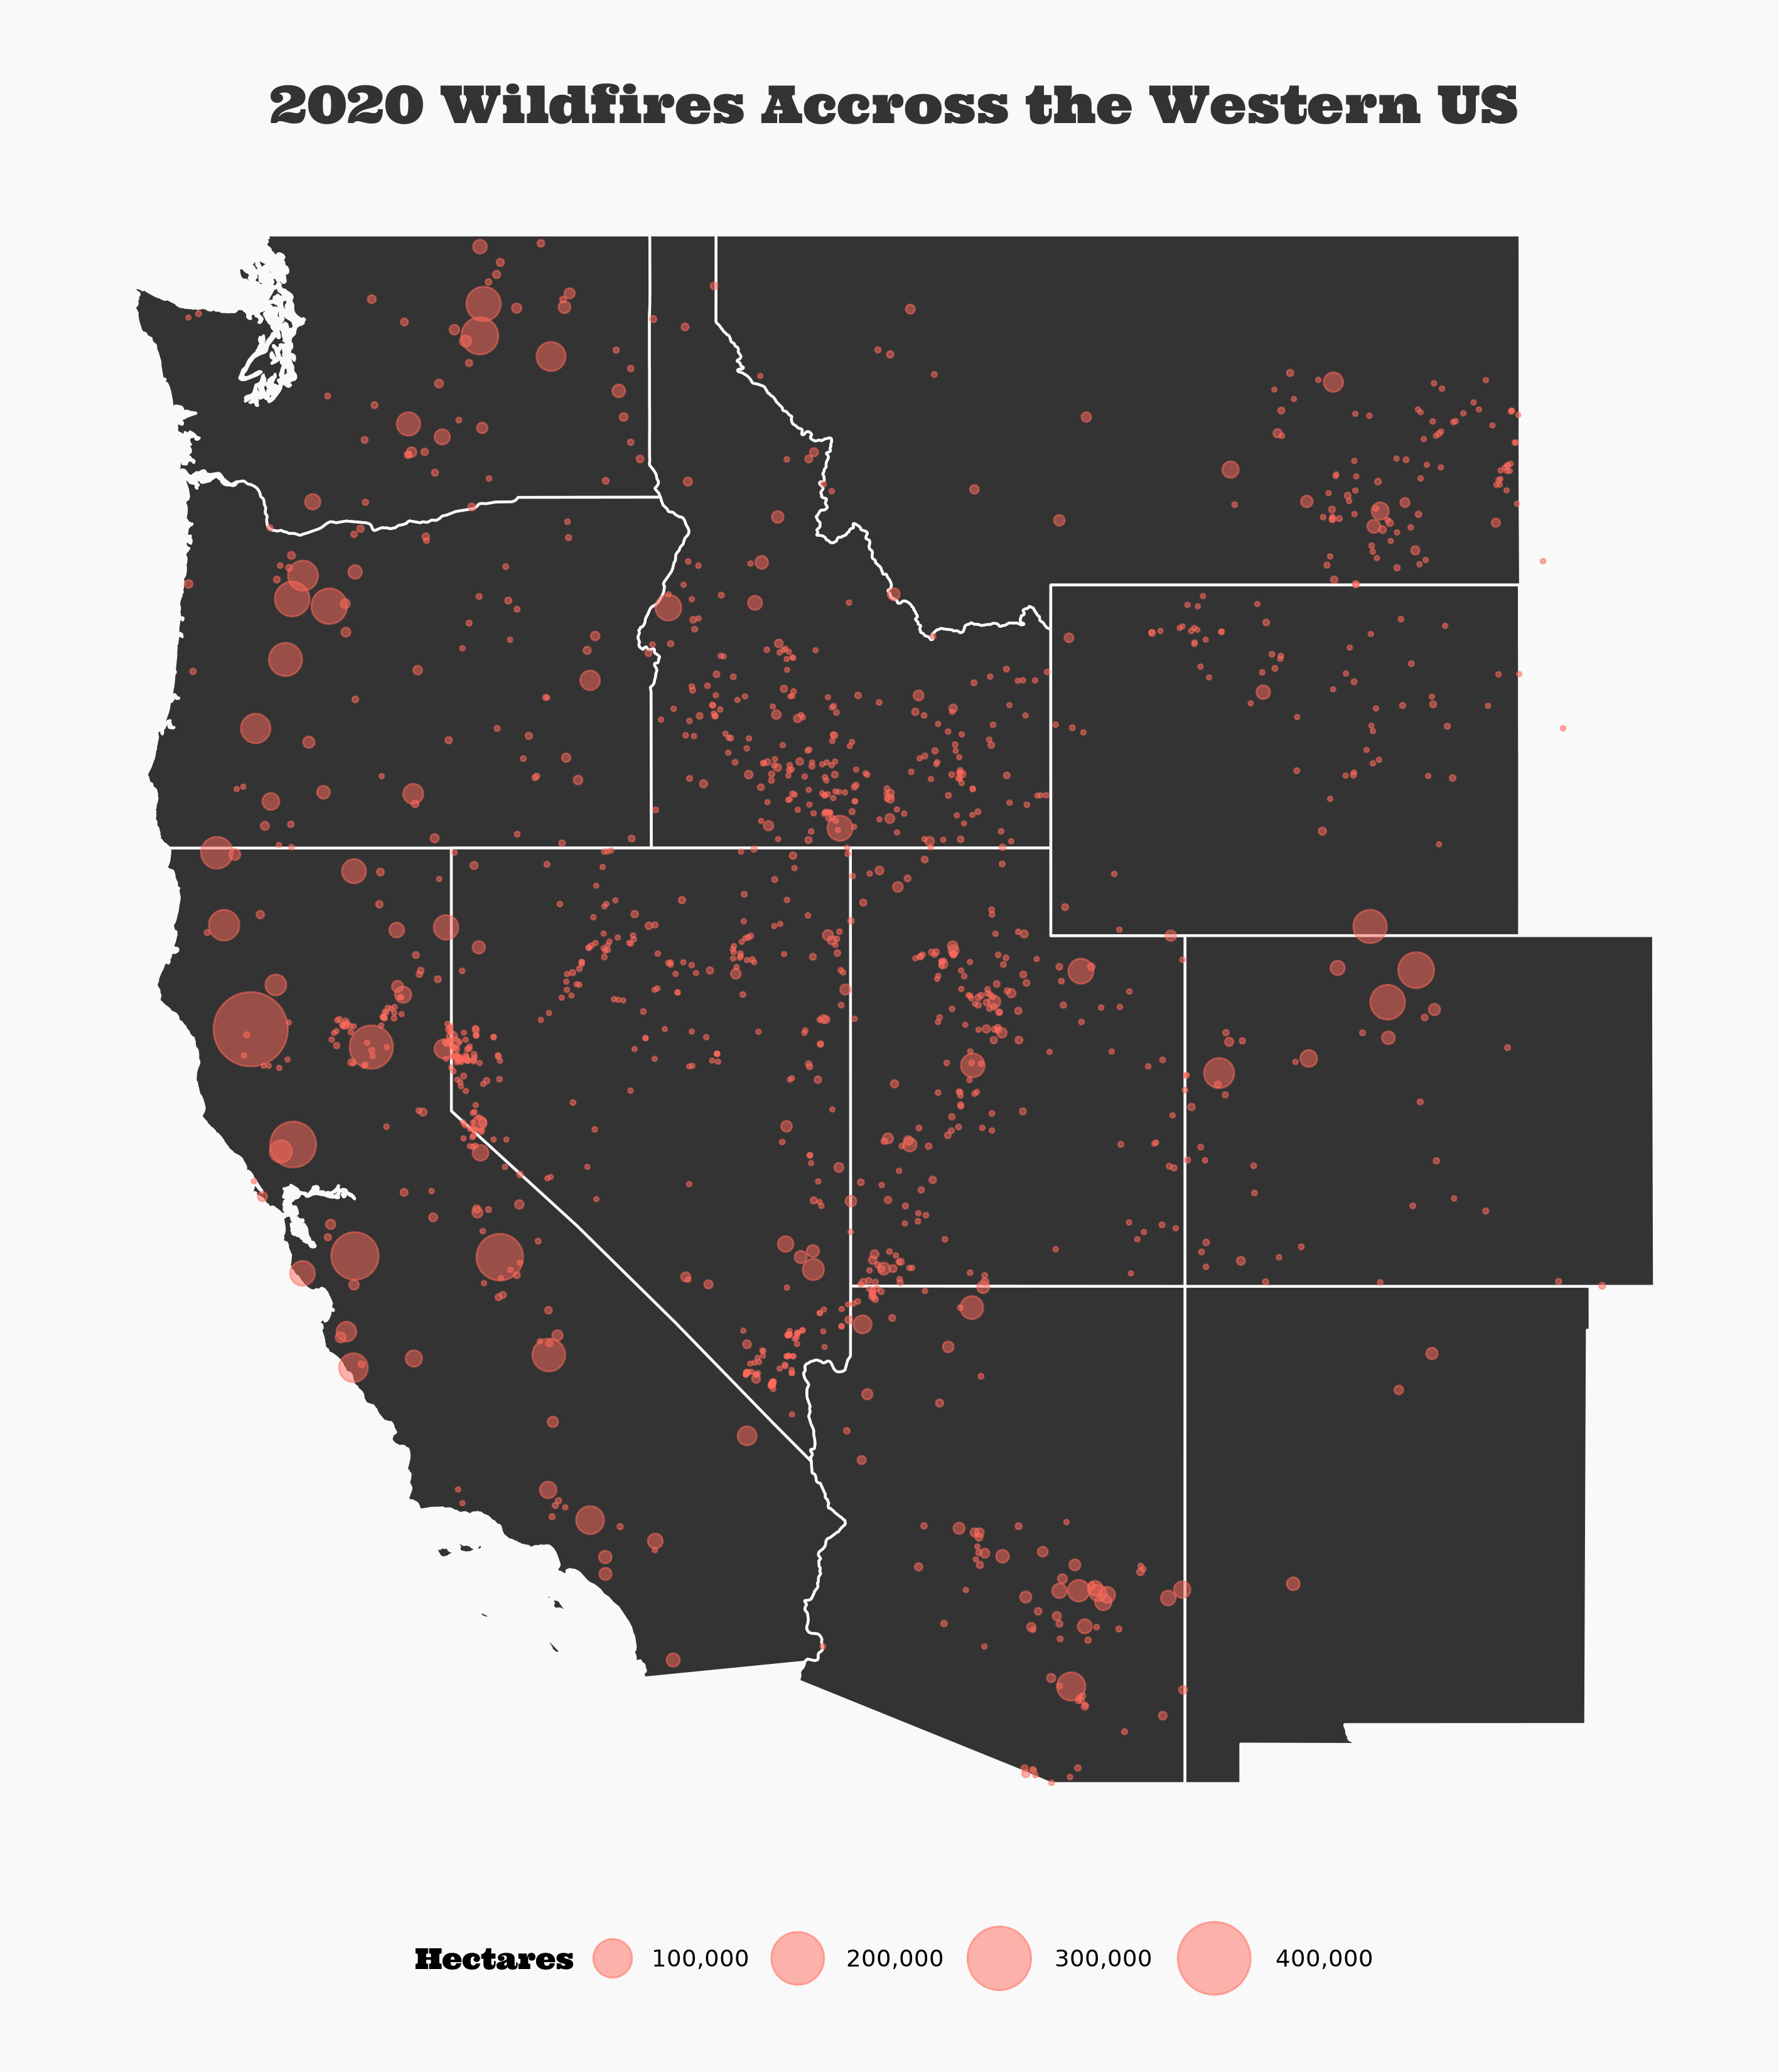
I'm starting the #30daymapchallange Points prompt by continuing my obsession with the current fire season. Here are all the fires from 2020 mapped as points. What a year.
library(sf)
library(schmidtytheme)
library(tidyverse)
library(rnaturalearth)
extrafont::loadfonts()

theme_set(theme_schmidt()+
            theme(
              text=element_text(family="Public Sans Regular"),
              plot.title=element_text(family="Ultra",size="30")
            ))

perimeters<-st_read("data/wildfire_perim/Public_NIFS_Perimeters.shp")%>%
  bind_cols(area_calc_msq=as.numeric(st_area(.)))

library(scales)
usa <- ne_states(country="united states of america", returnclass="sf")
the_west<-usa%>%
  filter(name %in% c("California", "Oregon", "Washington", "New Mexico", "Arizona", "Nevada", "Idaho", "Wyoming","Montana", "Utah", "Colorado"))


fire_data<-perimeters%>%
  select(IncidentNa, area_calc_msq)%>%
  mutate(area_calc_hect=area_calc_msq*0.0001)%>%
  st_crop(the_west)%>%
  st_centroid()

ggplot()+
  geom_sf(data=the_west, fill="#333333", color=background_color)+
  geom_sf(data=fire_data, aes(size=area_calc_hect), color="#FF6A5D", alpha=.5)+
  scale_size_continuous(range = c(0.5, 13), label=comma)+
  coord_sf()+
  labs(title="2020 Wildfires Accross the Western US",
       subtitle="",
       size="Hectares")+
  theme(
    plot.background=element_rect(fill = background_color, colour = NA),
    axis.text=element_blank(),
    panel.border=element_blank(),
    axis.line=element_blank(),
    plot.title=element_text(size=20),
    panel.grid.major = element_line(colour = "transparent"),
    legend.title=element_text(family="Ultra"),
    legend.position="bottom"
  )+ggsave("output/01-points-2020_wildfires_in_the_west.png", h=11, w=11, type="cairo")